
Slow website performance can have a significant impact on user experience, leading to higher bounce rates and lower conversions. One common cause of slow performance is slow CSS selectors. Selectors are used to identify the HTML elements to which the CSS rules apply, and complex or inefficient selectors can slow down page rendering and increase page load times.
Fortunately, Microsoft Edge provides a tool called Selector Stats that can help identify slow selectors and optimize them for better performance. In this article, we’ll explore how to use Selector Stats to improve website performance.
What is Selector Stats?
Selector Stats is a built-in tool in Microsoft Edge that provides information about the performance of CSS selectors on a webpage. It shows the number of times each selector is used, as well as the time it takes to match each selector. This information can help you identify slow selectors and optimize them for better performance.
To start using the Selector Stats in Microsoft Edge, follow these steps:
Step 1. Open the DevTools by pressing F12 or right-clicking on the page and selecting [Inspect element].
Step 2. Enable “Advanced Rendering Instrumentation”. Note that this setting slows down performance recordings, so turn it on only when necessary.

Step 3. Click on the [Selector Profiler] tab in the DevTools.
Step 4. Click on the [Start profiling] button to start recording selector performance data.
Step 5. Interact with the webpage and perform various actions, such as scrolling or clicking on links.
Step 6. lick on the [Stop profiling] button to stop recording selector performance data.
Step 7. Find a [Recalculate Style] event and click and review the Selector Stats report to identify slow selectors and optimize them for better performance.

Step 8. Click on the Selector Stats tab
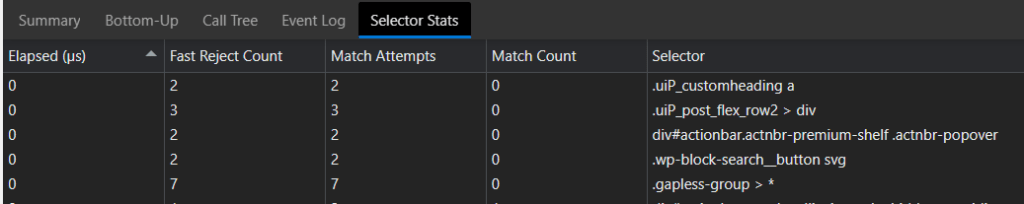
Key Metrics:
Elapsed time
Refers to the total time it takes for the browser to process all of the selectors on the page. This can be useful in identifying performance bottlenecks and in optimizing the CSS selectors to reduce the overall processing time.
Fast Reject Count
the number of times that the browser is able to quickly reject a selector without having to perform a full match. This occurs when a selector fails to match an element because it doesn’t meet the selector’s basic criteria (e.g., element type, class, or ID) and can be quickly rejected. The higher the Fast Reject Count, the more efficient the selector matching process.
Match Attempts
the number of times the browser must perform a full match to determine if a selector applies to an element. This can be used to identify selectors that may be too complex or inefficient, leading to longer processing times and poorer performance.
Analyze the result
For example, suppose you have a webpage with 1000 elements, and you’re using a complex selector to style all of the elements with a specific class. When you analyze the Selector Stats, you notice that the Match Attempts count for this selector is significantly higher than for other selectors on the page, indicating that the browser is spending more time processing this selector. By optimizing the selector, you may be able to reduce the Match Attempts count and improve the overall performance of the page. Once you’ve made changes to the selector, repeat the steps from the previous section to confirm that the Recalculate Style event duration has decreased.
Conclusion
Slow CSS selectors can have a significant impact on website performance, leading to slower page rendering and longer page load times. Selector Stats in Microsoft Edge can help identify slow selectors and optimize them for better performance. By simplifying complex selectors, avoiding universal selectors, combining selectors, and using efficient selectors, you can improve website performance and provide a better user experience.
In summary, Selector Stats in Edge provides developers with valuable information on how the browser is processing CSS selectors, helping to identify performance issues and optimize selector usage for faster page loading times.


Leave a comment